
Choosing a forecast horizon and a training window with Optuna#
Two questions come up in every forecasting project: how far ahead should the model predict (the horizon), and how much history should it be trained on (the window)?
Both are model selection problems, just like a learning rate or a number of layers. So we treat them as such: we score each candidate with a proper time series cross-validation, and we let Optuna search the space and keep track of the results.
What you will do here
Score a configuration with
ontime’s cross-validation helpers.Sweep a list of candidate horizons and read the results table.
Sweep the horizon and the training window together.
Look at the horizon / accuracy trade-off as a Pareto front.
Requirements: optuna, which ships with the dev dependency group of onTime (pip install optuna otherwise).
[1]:
# Import to be able to import python package from src
import sys
sys.path.insert(0, '../../src')
[2]:
import warnings

import numpy as np
import pandas as pd
import optuna

import ontime as on
from ontime.module.processing.cross_validation import evaluate_cross_validation
from ontime.module.benchmarking import BenchmarkMetric

optuna.logging.set_verbosity(optuna.logging.WARNING)
warnings.filterwarnings("ignore")

RANDOM_STATE = 42
np.random.seed(RANDOM_STATE)
1. Setup#
The data#
A synthetic hourly series with a daily seasonality, a weekly seasonality and a mild trend, so the notebook runs fast and offline. Replace it with your own on.TimeSeries to reuse the code as is.
[3]:
index = pd.date_range(start="2023-01-01", periods=24 * 60, freq="h")
t = np.arange(len(index))

daily = 10 * np.sin(2 * np.pi * t / 24)
weekly = 4 * np.sin(2 * np.pi * t / (24 * 7))
trend = 0.002 * t
noise = np.random.normal(scale=1.5, size=len(t))

df = pd.DataFrame({"consumption": 50 + daily + weekly + trend + noise}, index=index)
ts = on.TimeSeries.from_dataframe(df)

print(f"{len(ts)} points, from {index[0]} to {index[-1]}")
ts[: 24 * 7].plot()
1440 points, from 2023-01-01 00:00:00 to 2023-03-01 23:00:00
[3]:
The scoring function#
Everything below relies on one function: given a horizon and a training window, return the cross-validated error of a model.
evaluate_cross_validation does the work. It builds the folds, refits the model on the train set of each fold, predicts horizon steps ahead and aggregates the metric across folds. We use the sliding strategy so the training window stays a real degree of freedom (with expanding, the train set grows from fold to fold).
The metric is the MASE, which divides the error by that of a naive forecast. Being scale-free, it is easier to compare from one configuration to the next than a raw error.
[4]:
from darts.metrics import mase

MASE = BenchmarkMetric(name="mase", metric_function=mase)
N_SPLITS = 5


def evaluate(model, horizon, window):
    """Mean and std of the cross-validated MASE for a horizon and a training window."""
    results = evaluate_cross_validation(
        model,
        ts,
        metrics=MASE,
        n_splits=N_SPLITS,
        strategy="sliding",
        initial_train_size=window,
        horizon=horizon,
    )
    return results["mean"]["mase"], results["std"]["mase"]
A quick check with a seasonal naive model, before letting Optuna drive:
[5]:
from darts.models import NaiveSeasonal

mean, std = evaluate(on.Model(NaiveSeasonal(K=24)), horizon=24, window=24 * 14)
print(f"MASE = {mean:.3f} (+/- {std:.3f})")
MASE = 1.307 (+/- 0.267)
2. Sweeping a list of horizons#
The simplest sweep: a fixed list of candidate horizons, one cross-validation each, one table of results.
In Optuna terms this is a study with a ``GridSampler``: the search space is enumerated and the study stops once every combination has been tried. Compared to a hand-written loop we get the results bookkeeping, the best trial, and later on the pruning and the dashboard for free.
[6]:
from darts.models import LinearRegressionModel

HORIZONS = [1, 3, 6, 12, 24, 48]
WINDOW = 24 * 21


def horizon_objective(trial):
    horizon = trial.suggest_categorical("horizon", HORIZONS)
    model = on.Model(LinearRegressionModel(lags=48, random_state=RANDOM_STATE))
    mean, std = evaluate(model, horizon=horizon, window=WINDOW)
    trial.set_user_attr("mase_std", float(std))
    return mean


horizon_study = optuna.create_study(
    study_name="horizon_sweep",
    direction="minimize",
    sampler=optuna.samplers.GridSampler({"horizon": HORIZONS}, seed=RANDOM_STATE),
)
horizon_study.optimize(horizon_objective)
[7]:
results = (
    horizon_study.trials_dataframe(attrs=("params", "value", "user_attrs"))
    .rename(
        columns={
            "params_horizon": "horizon",
            "value": "mase",
            "user_attrs_mase_std": "mase_std",
        }
    )
    .sort_values("horizon")
    .set_index("horizon")
)
results
[7]:
| mase | mase_std | |
|---|---|---|
| horizon | ||
| 1 | 0.492685 | 0.251522 |
| 3 | 0.431817 | 0.045623 |
| 6 | 0.523251 | 0.068379 |
| 12 | 0.508320 | 0.102901 |
| 24 | 0.550760 | 0.083044 |
| 48 | 0.670632 | 0.230549 |
[8]:
print(f"Best horizon: {horizon_study.best_params['horizon']}")
print(f"Best MASE:    {horizon_study.best_value:.3f}")
Best horizon: 3
Best MASE:    0.432
Careful: the shortest horizon almost always wins#
This is the trap of any horizon sweep. Predicting one step ahead is easier than predicting forty-eight, so minimizing an error over a list of horizons tends to return the shortest one. That is a true, but useless, answer.
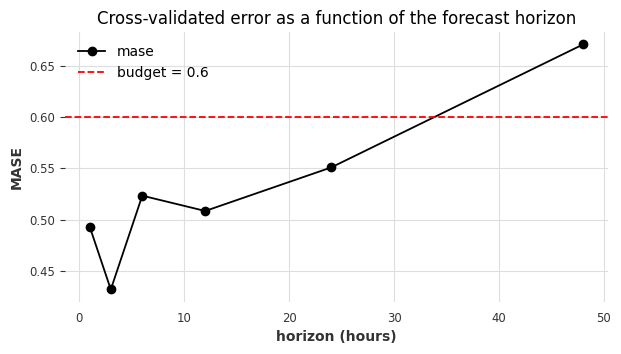
The table above is the interesting artifact: it shows how fast the error grows with the horizon. Three ways to turn it into a decision:
The question you are really asking |
How to set up the search |
|---|---|
Which window and model are best for the horizon my use case imposes? |
Fix the horizon, sweep the rest. |
How far ahead can I forecast before the error crosses my budget? |
Sweep horizons, compare to a threshold. |
What is the best trade-off between horizon and accuracy? |
Multi-objective, look at the Pareto front. |
The next cells illustrate the error budget, then section 4 covers the trade-off.
[9]:
MASE_BUDGET = 0.6

within_budget = results[results["mase"] <= MASE_BUDGET]
if len(within_budget):
    print(f"Longest horizon with MASE <= {MASE_BUDGET}: {within_budget.index.max()}")
else:
    print(f"No horizon reaches a MASE <= {MASE_BUDGET}")
Longest horizon with MASE <= 0.6: 24
[10]:
ax = results["mase"].plot(marker="o", figsize=(7, 3.5))
ax.axhline(MASE_BUDGET, color="red", linestyle="--", label=f"budget = {MASE_BUDGET}")
ax.set_xlabel("horizon (hours)")
ax.set_ylabel("MASE")
ax.set_title("Cross-validated error as a function of the forecast horizon")
ax.legend()
[10]:
<matplotlib.legend.Legend at 0x347896b60>
3. Sweeping the horizon and the window together#
The training window is the other half of the question, and the two interact: a longer horizon often needs more history to stay predictable. A nested loop would work, but the space grows quickly, so we switch to the default TPE sampler, which samples promising regions instead of enumerating everything.
Two details worth noting:
optuna.TrialPruneddiscards configurations that make no sense or do not fit in the series, which keeps the study clean without aborting the sweep;the number of lags of the model is thrown into the same search, since it is tied to the window.
[11]:
def horizon_window_objective(trial):
    horizon = trial.suggest_categorical("horizon", HORIZONS)
    window = trial.suggest_int("window", 24 * 3, 24 * 30, step=24)
    lags = trial.suggest_int("lags", 24, 96, step=24)

    if lags >= window:
        raise optuna.TrialPruned("lags must be shorter than the training window")

    model = on.Model(LinearRegressionModel(lags=lags, random_state=RANDOM_STATE))
    try:
        mean, _ = evaluate(model, horizon=horizon, window=window)
    except ValueError as e:
        raise optuna.TrialPruned(str(e))
    return mean


joint_study = optuna.create_study(
    study_name="horizon_window_sweep",
    direction="minimize",
    sampler=optuna.samplers.TPESampler(seed=RANDOM_STATE),
)
joint_study.optimize(horizon_window_objective, n_trials=30)

print(f"Best params: {joint_study.best_params}")
print(f"Best MASE:   {joint_study.best_value:.3f}")
Best params: {'horizon': 1, 'window': 552, 'lags': 24}
Best MASE:   0.397
Since the horizon dominates the error, the global best is once again the shortest horizon. Group the trials by horizon instead: each row is then the best window and lags for that horizon, which is what you actually deploy.
[12]:
trials = joint_study.trials_dataframe(attrs=("params", "value", "state"))
trials = trials[trials["state"] == "COMPLETE"]

best_per_horizon = (
    trials.sort_values("value")
    .groupby("params_horizon")
    .first()[["params_window", "params_lags", "value"]]
    .rename(columns={"params_window": "window", "params_lags": "lags", "value": "mase"})
    .round(3)
)
best_per_horizon.index.name = "horizon"
best_per_horizon
[12]:
| window | lags | mase | |
|---|---|---|---|
| horizon | |||
| 1 | 552 | 24 | 0.397 |
| 3 | 288 | 24 | 0.436 |
| 6 | 528 | 48 | 0.552 |
| 12 | 264 | 72 | 0.644 |
| 24 | 264 | 48 | 0.546 |
| 48 | 720 | 48 | 0.599 |
4. The horizon / accuracy trade-off#
The most honest phrasing of the problem: forecast as far as possible, as accurately as possible. These two goals conflict, so there is no single best horizon, there is a Pareto front. Optuna handles multi-objective studies natively, just return a tuple and give one direction per objective.
[13]:
def pareto_objective(trial):
    horizon = trial.suggest_categorical("horizon", HORIZONS)
    window = trial.suggest_int("window", 24 * 7, 24 * 30, step=24 * 7)
    lags = trial.suggest_int("lags", 24, 96, step=24)
    if lags >= window:
        raise optuna.TrialPruned("lags must be shorter than the training window")

    model = on.Model(LinearRegressionModel(lags=lags, random_state=RANDOM_STATE))
    try:
        mean, _ = evaluate(model, horizon=horizon, window=window)
    except ValueError as e:
        raise optuna.TrialPruned(str(e))
    return mean, float(horizon)  # minimize the error, maximize the horizon


pareto_study = optuna.create_study(
    study_name="horizon_pareto",
    directions=["minimize", "maximize"],
    sampler=optuna.samplers.TPESampler(seed=RANDOM_STATE),
)
pareto_study.optimize(pareto_objective, n_trials=40)
[14]:
front = (
    pd.DataFrame(
        [
            {
                "horizon": int(t.values[1]),
                "mase": round(t.values[0], 3),
                "window": t.params["window"],
                "lags": t.params["lags"],
            }
            for t in pareto_study.best_trials
        ]
    )
    .drop_duplicates()
    .sort_values("horizon")
    .reset_index(drop=True)
)
front
[14]:
| horizon | mase | window | lags | |
|---|---|---|---|---|
| 0 | 1 | 0.247 | 672 | 24 |
| 1 | 3 | 0.381 | 336 | 48 |
| 2 | 12 | 0.508 | 504 | 48 |
| 3 | 24 | 0.551 | 504 | 48 |
| 4 | 48 | 0.599 | 672 | 48 |
Each row is a non-dominated configuration: nothing tested forecasts further and more accurately. Choosing one is now a business decision rather than a statistical one.
What to remember#
Score a configuration with
evaluate_cross_validation, let Optuna choose which ones to try.Use
GridSamplerfor an exhaustive sweep, the default TPE sampler for larger spaces.Never pick a horizon by minimizing an error alone: use a budget, a fixed horizon, or a Pareto front.
Going further#
Several models at once. Suggest the model as a categorical parameter and build it inside the objective. Optuna supports conditional spaces, so each model can have its own hyperparameters, and you get a model x horizon comparison in a single study.
Persistence and dashboard. Pass
storage="sqlite:///horizon_sweep.db"andload_if_exists=Truetooptuna.create_studyto resume a sweep, then inspect it withoptuna-dashboard sqlite:///horizon_sweep.db.Parallelism.
study.optimize(..., n_jobs=-1)runs trials in parallel, and with a shared storage several processes can feed the same study.Pruning. For deep models, stop hopeless trials early with a pruner, as shown in Optimize model hyperparameters using Optuna.
Other validation schemes.
evaluate_cross_validationalso acceptsstrategy="expanding"or"blocked", and agapfor purged validation. See the cross-validation guide.Parameter importance. How much does the horizon really matter compared to the rest?
[15]:
optuna.importance.get_param_importances(joint_study)
[15]:
{'window': 0.7039159264526447,
 'horizon': 0.20179455288155612,
 'lags': 0.09428952066579922}